
Carbon Roadmap
A planning tool for companies to track emissions, model decarbonisation measures, and visualise their path to net zero — with carbon ROI for every action.
UX Researcher, Product Designer
2024-11-01
The Problem
Companies face carbon reduction targets from multiple directions at once — EU Fit for 55, SBTi 1.5°C pathways, Net Zero 2050, and their own internal commitments. The targets are clear. The path is not.
Most tools track what has already happened. This one plans what comes next: which measures to implement, in what order, at what cost, and what the resulting carbon trajectory looks like year by year.
Two Questions Every Client Asks
Where are we now? Total emissions across all assets, broken into Scope 1, 2, and 3. A single company-level baseline, not a per-building exercise.
How do we get to target? A menu of decarbonisation measures — solar, heat pumps, LED retrofits, fleet electrification — each with an implementation cost, an upfront carbon cost (embodied in the works), and a long-term annual reduction once complete.
The tool answers both, and connects them through the roadmap.
Carbon ROI
Every measure carries a trade-off. Installing a heat pump has a capital cost and emits carbon during manufacturing and installation. Over time, it reduces energy consumption and the company's annual emissions. The tool calculates this explicitly:
- CAPEX — one-time implementation cost
- Implementation emissions — upfront CO₂e from the works themselves
- Annual reduction — tCO₂e saved every year once live
- Payback — how many years until the reduction outweighs the upfront cost
This makes decarbonisation legible to finance teams — not just sustainability managers.
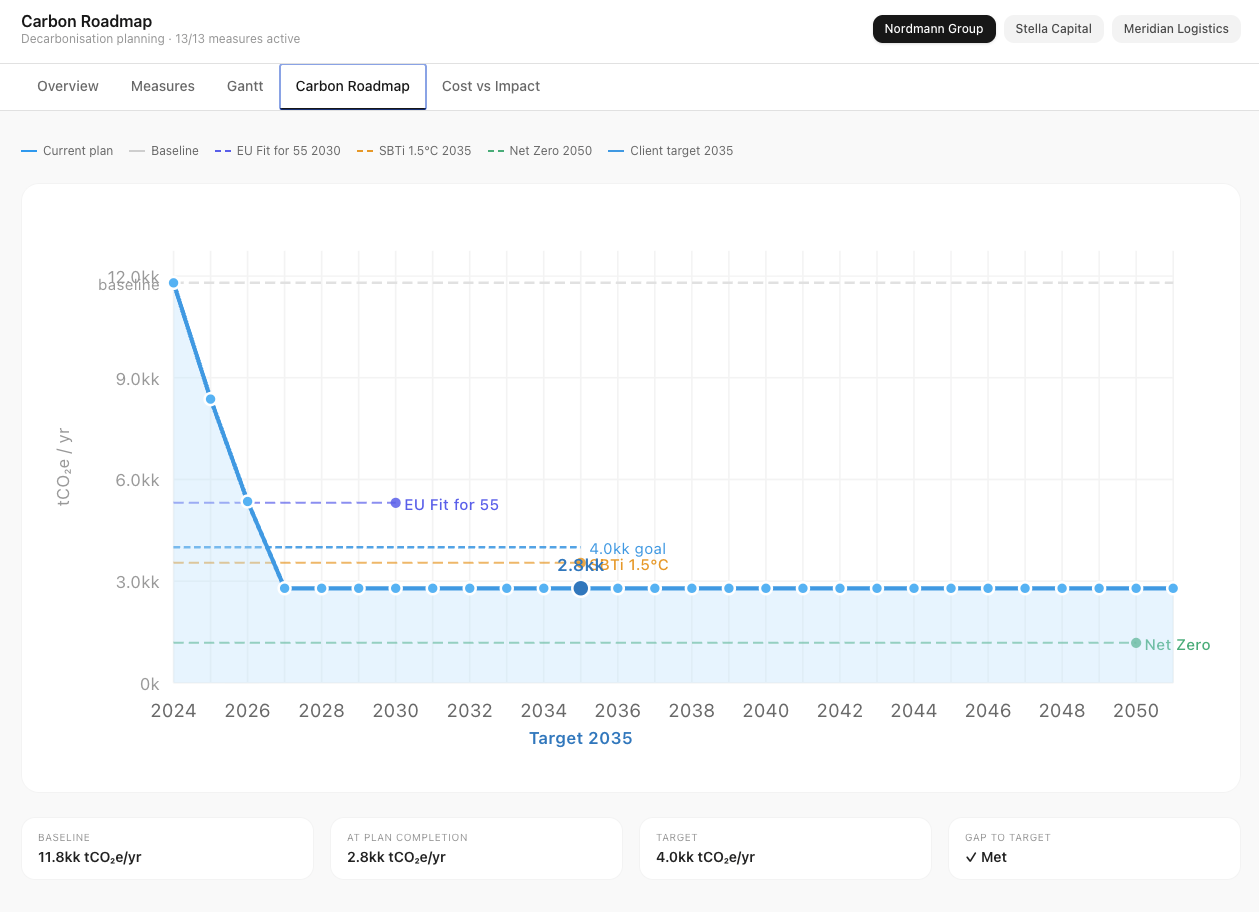
The Roadmap
The central view is a carbon trajectory chart: the company's emissions year by year, shaped by which measures are active and when they complete.
Multiple reference lines sit on the same chart — EU Fit for 55 (2030), SBTi 1.5°C (2035), Net Zero (2050) — so the company can see in one view where their plan lands relative to each benchmark. The client's own internal target is plotted separately.
Toggling measures on and off updates the trajectory in real time. The gap between the current plan and each regulatory target becomes immediately visible — and actionable.
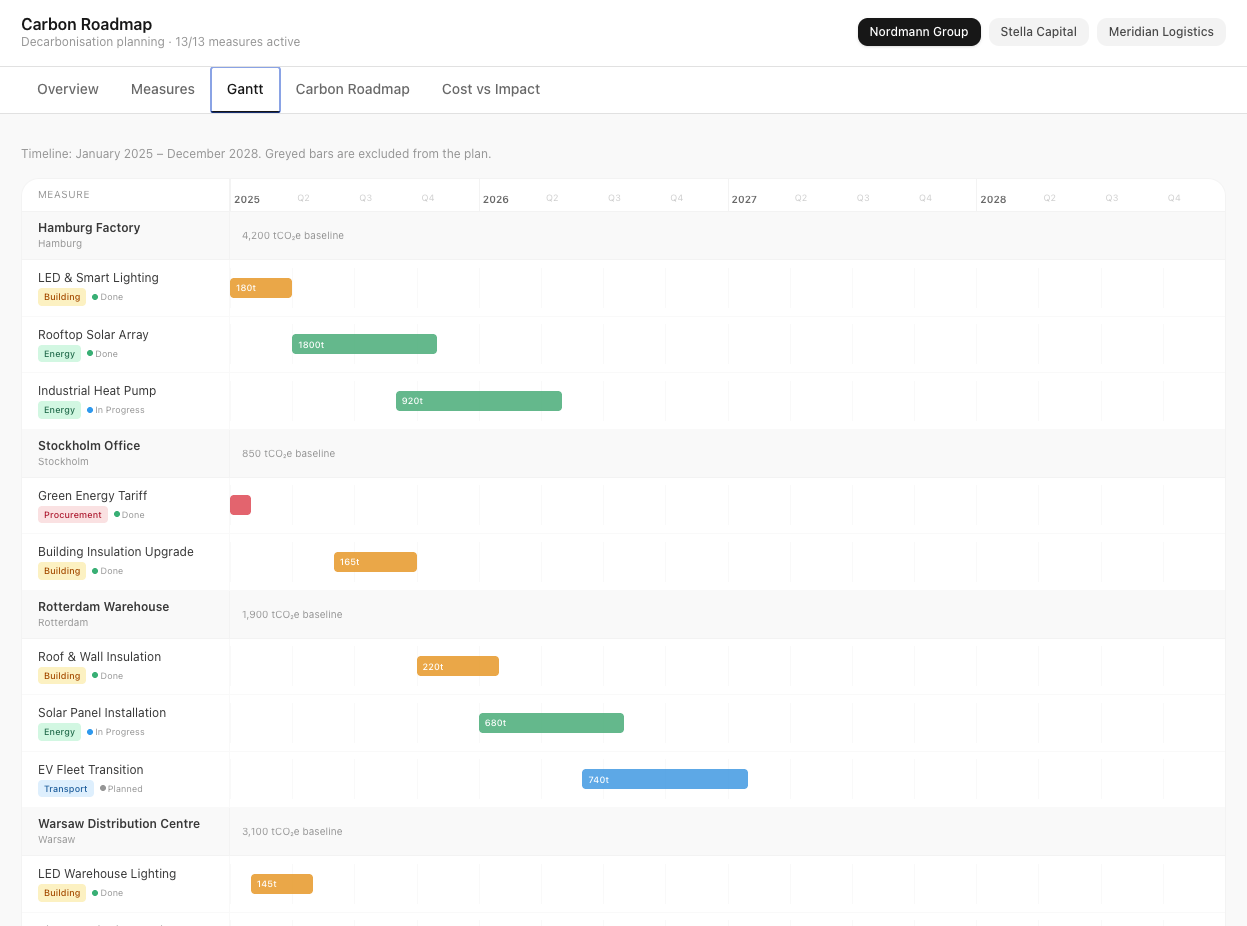
Measure Planning
The measures list is the planning workspace. Each measure shows its category, timeline, cost, and reduction impact. Users can include or exclude measures to model different scenarios — a conservative capital plan versus an accelerated decarbonisation path.
The Gantt view maps the same measures onto a timeline, showing which are in flight, which are planned, and how the implementation schedule stacks up against the key regulatory deadlines.
What the Tool Makes Possible
Before this kind of tool, carbon planning lived in Excel. Measures were tracked in one sheet, costs in another, emissions projections in a third — and they never stayed in sync.
The roadmap keeps them connected. A change to the measure list immediately propagates to the trajectory, the cost summary, and the gap analysis. The plan and the data are the same thing.